

Restaurants Food Waste in Jenks: Causes and Fixes
The United Nations Environment Programme estimated that 931 million tonnes of food were wasted at household, retail, and food-service levels in 2019, about 17% of all food available to consumers. Food service, restaurants included, accounted for approximately 5% of that consumer-level waste. On a Main Street line in downtown Jenks, that share is not an abstract slice. It is trim in the prep sink, a hotel pan that never left the pass, and a plate that came back half full after a Saturday on The Ten District.
We walk those kitchens often enough to know the dumpster is the last stop, not the first decision. A small crew cannot fix a global total. It can log what leaves the board, change one purchasing habit, and stop treating every leftover as trash. The rest of this is that local version: where restaurants food waste starts, how to weigh it without blaming the cook, and what Oklahoma law lets a Jenks dining room donate or compost.
Table of Contents
Where Restaurant Food Waste Starts and What It Adds Up To
If you only remember one line for a pre-shift meeting, use this one. Congressional Research Service analysis of EPA estimates put food-service providers at approximately 40% of combined retail, food-service, and residential wasted food, roughly 26.5 million tons. In 2019, EPA estimated 66 million tons across those same sectors, and about 60% went to landfills. Only 5% was composted. EPA also states that wasted food is responsible for 58% of landfill methane emissions.
Measure | Figure | What It Means for a Kitchen |
|---|---|---|
Food-service share of consumer-level food waste, global (UNEP, 2019) | About 5% | Restaurants are one slice of a larger system |
Food-service share of combined US sector waste | About 40%, roughly 26.5 million tons | Food service is the biggest slice of the combined estimate |
US wasted food sent to landfills (EPA, 2019) | About 60% | Disposal is the default unless a plan changes it |
US wasted food composted (EPA, 2019) | 5% | Diversion is the widest gap |
Share of landfill methane from wasted food (EPA) | 58% | Waste in the bin is a climate issue too |
Preparation waste in restaurants | 45-65% of restaurant waste | Start with purchasing, prep and trim |
Plate waste in restaurants | 30-34% of restaurant waste | Portion design drives this share |
Read the table the way a closer reads a ticket. Preparation is where most restaurant waste starts, in the 45-65% band, so the first look is the board, the walk-in, and the trim bucket. Plate waste, about 30-34%, is a portion-design problem, not a personality problem at the table. The landfill row is the default. Without a plan, most of what you throw still goes to a landfill, and that organic load is a climate problem because it drives 58% of landfill methane.
Earlier USDA estimates found that 31% of food available at U.S. retail and consumer levels, approximately 133 billion pounds valued at nearly $162 billion in 2010, was not eaten. That dollar figure will not move a Main Street budget. The number that does is your own purchase cost per pound. Once a pilot gives you pounds lost by category, multiply by that cost. You get a monthly dollar figure for prep losses, plate returns, and close-of-day surplus, which is the kind of leak that shows up in business retention on our downtown corridor.
Practical rule: Look at the prep line first, then the plate, then the dumpster.
Global totals are estimates, and restaurant measurement is still thin in a lot of places, so a local log will beat any national average. Holding food at a steady cook, rather than parking a full pan "just in case," is part of that control. Crews who already know why commercial kitchens trust Unox are usually chasing repeatable times so a batch does not die in the window.
How to Measure Waste by Stage in a 30-Day Pilot
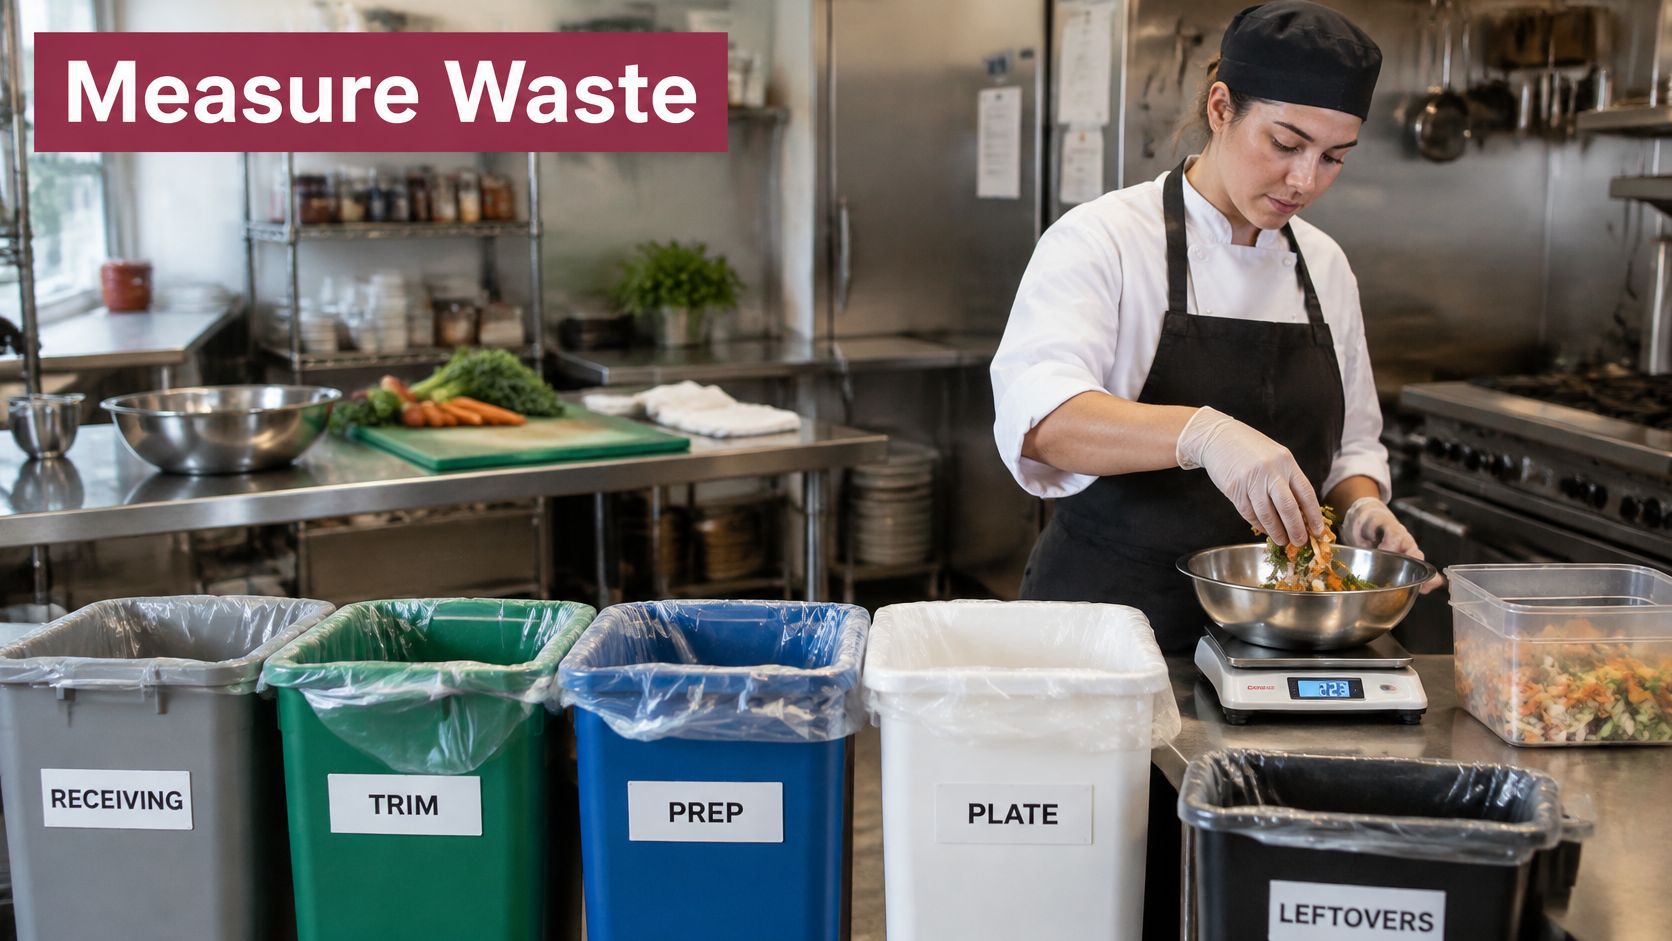
You do not need new software to see where food goes. UNEP's account of city and business measurement notes that counts inside restaurants and hotels still are not widespread, and that streams stay messy: prep scraps, spoilage, buffet leftovers, plate waste, and cancelled orders. IFC guidance specifically notes that employees may fear waste tracking if managers treat it as evidence of poor performance. The method that holds up is consistent and reliable, not a camera over the can.
I would start with the cheapest fix: a gram scale, four bins, and a wall log for 30 days.
Pick one full service week as the pattern, then keep the same scale and the same clock times for the rest of the month. A festival Saturday and a quiet Tuesday both belong in the sample, or the average lies.
Split waste into four bins: receiving and trim losses, cooked food never served, plate returns, and unserved surplus at close. Mixing them into one bucket hides the decision you can change.
Weigh each bin at the same times every day and write down covers served. Grams only matter next to how many people ate.
Beside each weight, write the likely cause in plain words: an over-prepped batch, a cold walk-in, a large party that did not show. Cause is what you buy against next week.
Keep the sheet on the wall where the crew can see the count. Say out loud that the goal is the process that failed, not a name next to a number. If someone shorts the log because they expect a lecture, the month is wasted.
Separate edible waste from inedible waste, bones, shells, and peels included. A peel bucket and a usable-trim bucket answer different questions.
After 30 days, calculate grams of waste per cover, food cost lost per category, and the share that was preventable. Then change one item, not the whole menu.
What the month is allowed to prove
Simple direct weighing usually beats a "smart" bin when staff time and cash are tight. A sensor will not tell you that Thursday's chili was built for a Main Street crowd that went to the river instead. A handwritten cause will.
Special-diet plates change the return bin too. If you are already plating for guests who use gluten-free options at local restaurants, log the dish name. A returned bowl of pasta and a returned steak are not the same purchasing problem.
Post the weekly total where everyone can see it, and never post a person's name next to it.
If you later run the same categories at more than one downtown kitchen, financial reporting across multiple waste sites keeps "trim" from meaning something different on each sheet. One chart of categories, one scale, one rule about blame.
Cutting Prep Waste with Par Levels and Forecasts
Prep waste is an ordering problem that shows up later as spoilage. The chain runs in one direction. Over-purchasing or a weak demand forecast comes first. Excess preparation follows. Then improper storage, expiration, and oversized portions. Kitchen and buffet research from Bournemouth University.pdf) treats this as an operational-control problem, not a single disposal problem. Daily weights by stage, tied to covers and menu item, support tighter pars, FIFO rotation, smaller batches, and recipe-specific trim standards.
That paper's buffet work is the useful local lesson. Waste per customer ran lower on weekends when group bookings improved the forecast. Weekday uncertainty pushed kitchens to hold more variety, and variety produced more waste. A reservation book and an event calendar are waste controls. They are not front-desk paperwork.
Say a downtown dining room treats a festival weekend like any other Friday. The walk-in is full by Wednesday, the alley fills with unused prep by Sunday, and nobody can say which dish missed. Put the event on the forecast the same way you put a 20-top on the book. Weather, day of week, and last month's item sales belong on that same sheet.
Cause | Control | Metric to Track |
|---|---|---|
Over-purchasing and weak forecasts | Par levels from item-level sales | Pounds bought vs. used per menu item |
Excess preparation | Smaller batches set by the reservation book | Trim and unused prep weight per shift |
Improper storage and expiry | FIFO rotation with dated labels | Spoilage grams by category per day |
Weekday demand swings | Reservations and event calendar in the forecast | Grams wasted per cover |
Oversized portions | Weighed or volume-calibrated scoops | Returned plate weight per dish |
Build pars from what sold, not from the feeling that Saturday "always pops." Date every pan. New deliveries go behind older stock. Drop batch size to what the book shows for the next two hours, then fire another batch if the door fills. A scoop that is weighed or volume-marked stops the quiet creep where Tuesday's portion is an ounce heavier than Monday's.
One test is enough. When grams per cover jump after a menu change, move the par on that item before you rewrite the recipe. Group dining around downtown Jenks is the sharpest version of this. A booked party tells you how many proteins to pull. An unbooked hope does not.
Do not promise a savings percent from a par tweak. Weigh the next two weeks and let the sheet say whether the batch got smaller for a reason.
Plate Waste, Portions and Leftovers Diners Take Home

Containers are not the whole fix. ReFED's 2025 portion study with Datassential reports that nearly 70% of restaurant and foodservice waste is food customers leave behind, yet only 60% of consumers took restaurant food home at least once in the previous month. 40% did not. The same study found that about 20% of surveyed diners left uneaten food after their most recent meal. Whether they took it, and ate it, varied with meal price, food type, age, gender, and employment status.
Offering a box and hoping is a weak plan. You need to know which foods still taste right the next day, and whether the guest eats what they carry out.
Portion and service research points at large portions and unwanted sides as common causes of avoidable plate waste. The useful moves are smaller defaults, opt-in sides, and a light ask before the plate is cleared. Each one trades something.
Smaller default, cheap add-on: Guests still choose more food. You stop plating the extra on every cover. Watch complaints. If people feel shorted, the check average argument comes back fast.
Opt-in sides: An unwanted starch becomes waste even when the entrée is finished. Families on a downtown Jenks menu often do better when fries, bread, or a vegetable are a choice, not a bundle.
Half-orders: They fit mixed tables, kids through grandparents. They can clash with perceived value in full service, so track repeat orders and add-on requests, not just the weight of returns.
Ask before you clear: A simple "Would you like this packed?" beats scraping a plate the guest meant to take. Keep the tone light. Nobody wants a speech at the table.
A visible take-home note: Helps family groups and visitors who are walking Main Street and do not know the house will pack food. It does not fix a portion that was too big to begin with.
Test one dish for two weeks. Weigh what comes back, then ask whether the packed portion was eaten, not merely boxed. Food that has been on a customer's plate is never re-served. That rule protects the guest and keeps later donation talk honest.
Donating Surplus Food Under Oklahoma Law
House Bill 1542, effective November 1, 2023, grants civil liability protection to restaurants and public-school cafeterias that donate leftover food in good faith. For a dining room in The Ten District, that removes one legal worry. It does not replace temperature control, labels, or a nonprofit that can receive the food.
Oklahoma's donation statute covers perishable and nonperishable food that is fit for human consumption, including food that is no longer readily marketable because of appearance, freshness, grade, or another condition. A good-faith donor is generally protected from civil damages or criminal penalties tied to the food's nature, age, condition, or packaging. Gross negligence, recklessness, or intentional misconduct removes that protection. Spoiled food donated willfully or negligently sits outside the bill as well.
ReFED's Oklahoma policy scan is clear that the state has no statewide organic-waste ban or food-recycling mandate, so composting and donation stay voluntary for Jenks kitchens. The same rules add a dating limit. Refrigerated, ready-to-eat time-and-temperature-control food prepared and held in a food establishment for more than 24 hours generally must be marked with the date by which it must be consumed or discarded.
Food Case | Donate? | Condition That Applies |
|---|---|---|
Packaged nonperishable food fit to eat | Yes | Donor is protected when acting in good faith |
Cosmetically imperfect produce or bakery items fit for consumption | Yes | Fit for human consumption, not appearance alone |
Refrigerated ready-to-eat food held over 24 hours | Only if dated | Mark the consume-or-discard date |
Spoiled or questionable food | No | Willful or negligent donation removes protection |
Food returned from a customer's plate | No | Never re-served or donated |
Close of service, in order
Sort by case while the line is still staffed, not during tomorrow's open. Check fitness and the date mark before anything goes in a donation pan. Log what leaves, who takes it, and the temperature at handoff. Confirm the recipient can take refrigerated items that same night. A bakery tray that looks tired but is still safe to eat can go. A pan you would not serve your own table cannot.
The law is a shield for good-faith, fit food. It is not a reason to stretch a hold time or skip a label.
Food Scrap Composting Benchmarks Across the Tulsa Metro
Food-scrap diversion already runs at a real scale in the Tulsa metro. Fertile Ground's 2025 totals show 230,642 pounds of food scraps collected from commercial customers, equal to 115.3 tons. Across residential and commercial customers, the co-op reported diverting 311,351 pounds, or 155.6 tons, from landfills that year. Those two figures are the benchmarks. Hold any hauler conversation against pounds, not a slogan.
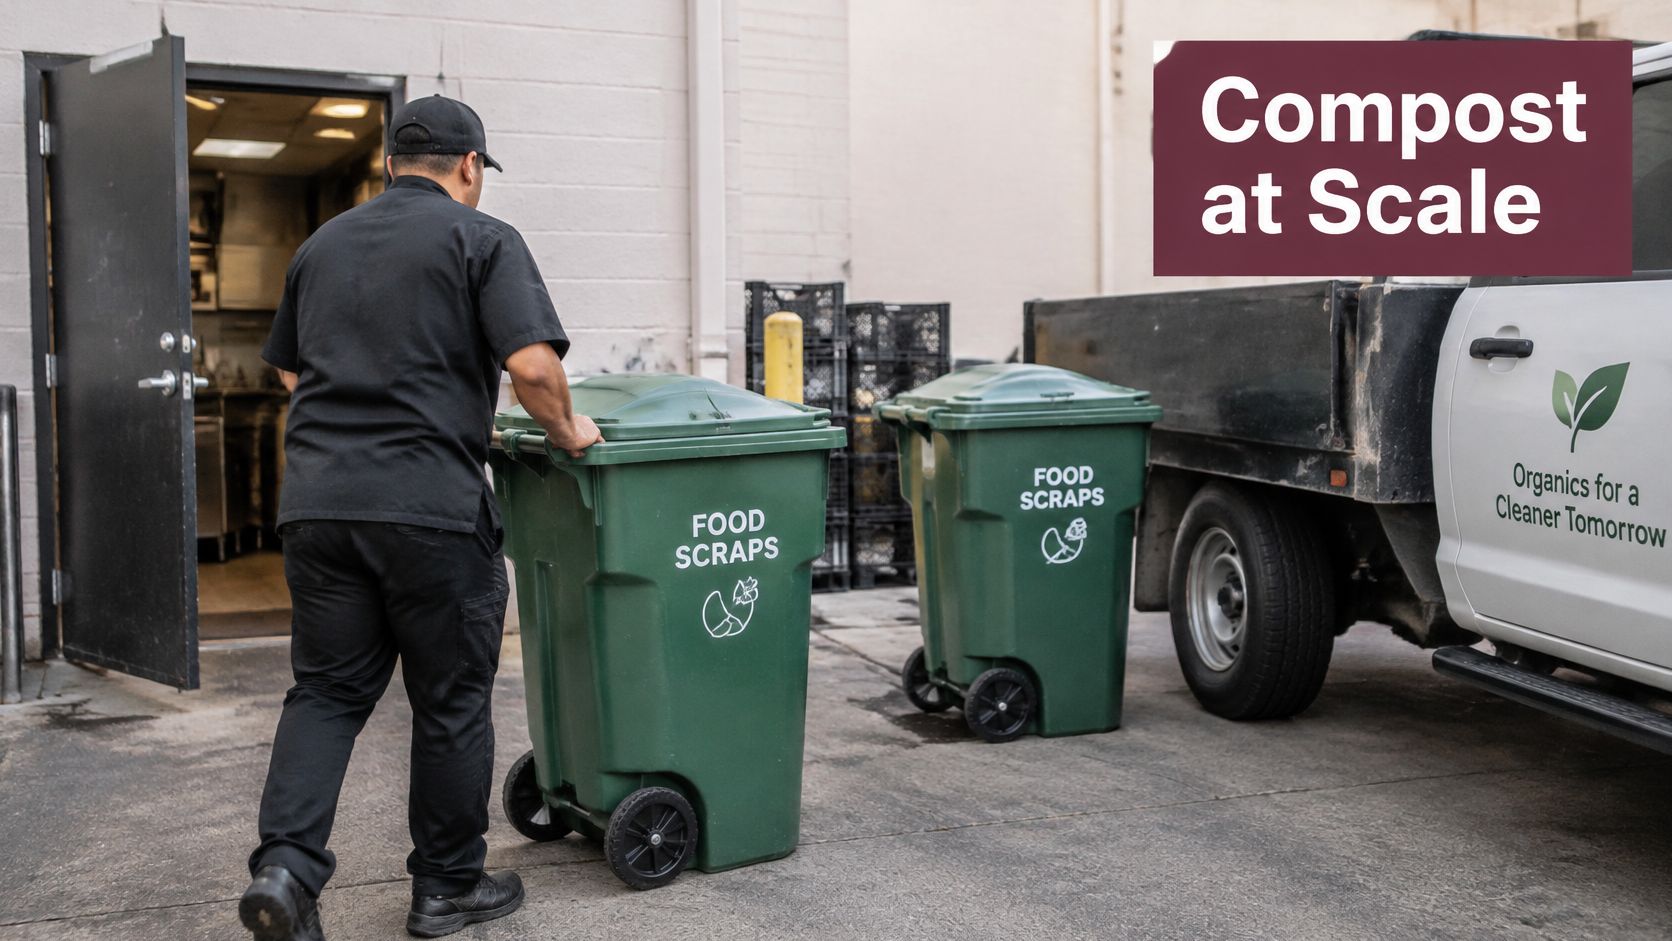
Start with your own log. Add the pounds of prep scraps, trim, and unserved surplus that a composter will take. Leave out bones, shells, and anything the provider refuses. That monthly pound figure is the only honest comparison between a small Main Street kitchen and a high-volume dining room.
Ask the provider for pounds per pickup and pickups per week. Multiply pounds per pickup by pickups in a month. If your log says you have 400 pounds of accepted scraps and the route is built for a much larger account, you are buying capacity you will not fill. A shared stop with a neighbor can make more sense than a dedicated truck.
Before you commit, ask about pickup frequency, who washes the container, which items are refused, and whether the truck can collect at the back door off the alley so bins are not blocking the sidewalk at lunch. Do not assume a price. Use a published rate if the provider prints one, and otherwise get it in writing for your address.
A busy weekend crew and a weekday prep kitchen will not share a monthly number. Compare pounds per month. That is the whole sustainability claim a small crew can stand behind.
Pick One Waste Fix for Your Kitchen This Month
The first month is the weigh-in. Every other fix depends on knowing which stage loses the most food. Change one thing, run it for two weeks, and repeat the weigh-in on the same clock. Compare grams per cover before and after. If the number does not move, you picked the wrong lever, not a moral failure.
Pilot result | First fix | Next step |
|---|---|---|
Prep and receiving losses largest | Change one par level and one batch size | Re-weigh trim and unused prep for two weeks |
Plate returns largest | Test one smaller default portion or an opt-in side | Track leftovers actually eaten, not just packed, and watch repeat orders |
Close-of-day surplus largest | Set a donation log and confirm a recipient | Check fitness and dates against the donation rules |
Steady weekly pound figure | Compare provider pickup quotes | Choose organics collection only if the monthly estimate fits |
I would not add organics collection until that weekly pound figure is steady enough to set next to a quote. A bin with no baseline becomes another container to trip over in the alley.
Match the biggest stage and stop there for the month. If prep dominates, one par and one smaller batch. If plates dominate, one dish with a smaller default or an opt-in side, then ask whether leftovers were eaten. If the close-of-day pan dominates, write a donation log and name the recipient before you change the menu. Lunch service on our Main Street restaurants is a clean place to see the pattern, because the window is short and the covers are easier to count than a scattered dinner.
If the log shows the room can carry a tighter menu, or a new concept next door, our personalized incentive roadmap outlines up to $250,000+ in available incentives for new retail and restaurant concepts, including TIF district opportunities, façade grants, and development programs. That is a planning conversation, not a reason to skip the scale.
Send us the first month's numbers, stage by stage, with the covers attached. Our downtown picture stays accurate only if the kitchens on this street are in it.
The Ten District is the ten-block stretch of downtown Jenks where these kitchens, shops, and festival nights sit, and we keep writing the practical side of running a room here, from what gets donated to what belongs in a scrap bin. If you are tightening purchasing, portions, or a pickup schedule on Main Street, start with the local notes on The Ten District and tell us what your first 30-day log showed.


Comments